
May 7, 2020
The current situation has caused damage to the economy all over the world. The FED stepped in with unprecedented quantitative easing. Historically, QE by the FED has led to higher yields and lower bond prices. We look at various inter-market relationships to find clues about the possible direction of market.
Bonds
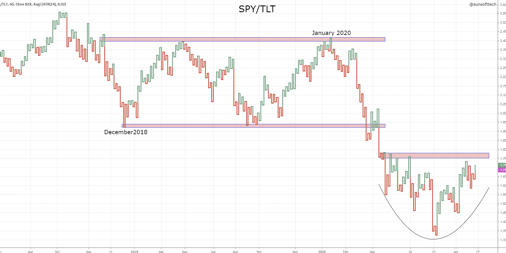
Bonds are risk off assets. Higher bonds lead to lower yields. In January 2020, even though markets were moving up, SPY started underperforming relative to bonds. This was an indication that money was rotating away from stocks and going into bonds – a risk off signal, calling for
some profit booking and better risk management in stocks.
SPY/TLT
TLT (20+ yr Treasury bond ETF)
This thesis was supported by other bond charts. On Feb 20, 2020, a day after all time high in SPY,
10-Yr Treasury note TYSPOT was coiling at a major resistance, ready to break out. An upside breakout indicated bearishness for stocks and further lows for 10-Yr Yield which was already near a record low at 1.515%. It also pointed to a possibility of a negative interest rate environment for the US on the lines of Germany and Japan.
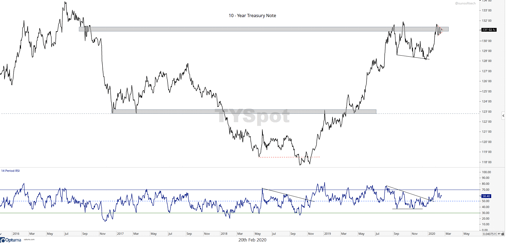
TYSPOT – 10 -Yr Note did break to the upside followed by the market meltdown.
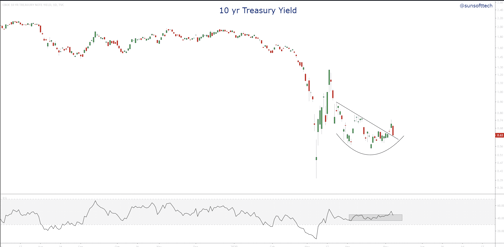
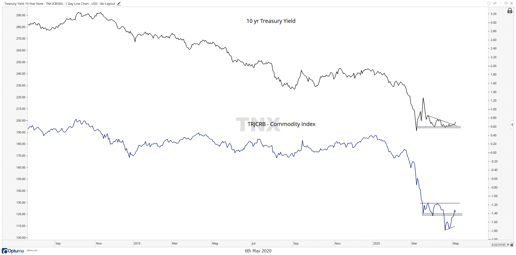
After a strong up move from January 2020, TLT and other bonds closed lower in April. Yields fell to record lows, then pulled back, resumed downtrend, then moved sideways and started building a base. This brings up a possibility of higher yields.
TNX (10-Yr Treasury Yield)
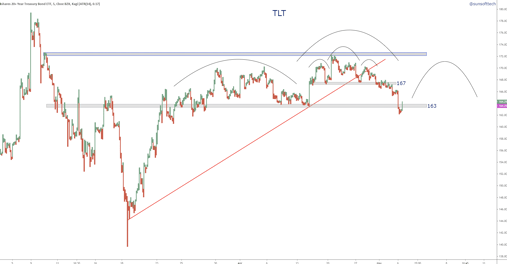
TLT

Kagi chart of TLT hints at a possible H&S formation under way which supports the higher yields hypothesis. A right shoulder may form with TLT consolidating between 163-167. A break below 163 support zone from March suggests further downside and rotation away from bonds
Rising yields will have a cross asset impact
Commodities – Yields and commodities move up together
Metals
Steel, copper have positive one month returns, which leads us to copper/gold ratio and copper. The Copper to Gold ratio is a good indicator for global economic growth. When Copper outperforms Gold, the ratio rises indicating positive risk-appetite and global growth. It is also highly correlated to the US 10-Yr Treasury yield. Over the past few weeks, the Copper/Gold ratio has been consolidating below 2009 lows, and it is now attempting to break back above this key level. If Copper/Gold ratio is able to break out and continue higher. In the short term, it would be a positive sign for risk-appetite and the 10-year US Treasury yield would likely follow higher as well.
Bullish for stocks
Copper
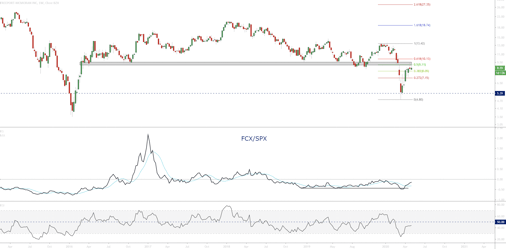
Freeport McMoran is one of the largest copper (and gold) miners in the world. It is a good proxy for economically sensitive copper. It gave a normalized 34% return in 1-month. It is rising relative to SPX but still below a major resistance from 2016. A break above the resistance suggests a possible upwards move in copper.
Bullish for stocks
Freeport McMoran
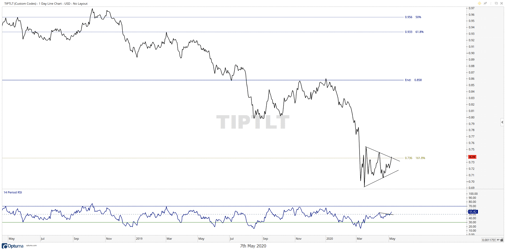
Treasury Inflation-Protected Security (TIPS)
Rising commodity prices are inflationary. Treasury Inflation-Protected Security (TIPS) is an inflationary gauge to protect investors from the decline in purchasing power of their money. As inflation rises, TIPS goes up. In an inflationary environment, TIPS/TLT ratio moves up. TIPS relative to TLT is breaking out of a triangle formed at 161.8% extension of the down move. The momentum is in bullish territory above 50. Upside breakout further supports weaker bonds.
Higher yields lead to increased cost of borrowing
Regional banks (KRE) and real estate(IYR) are two interest rate sensitive groups. Higher yields lead to increased income for regional banks as they earn more money by lending at higher interest rates. Hence, regional banks move up with yields.
On the contraty, higher interest rates have a negative impact on real estate as the cost of borrowing goes up. Real estate is negatively correlated with yields and moves down as yields move up. KRE/IYR also has a high corelation with 10-Yr yield.
Higher yields are favorable for KRE. KRE/IYR ratio will move up in a higher yield environment.


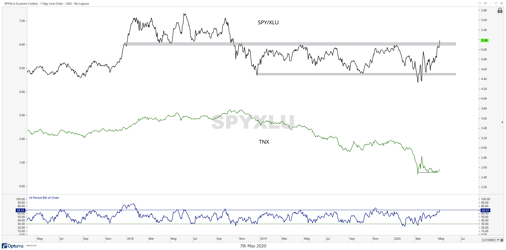
Utilities and Minimum Volatility are risk off pointers
They move up relative to S&P 500 when stocks are in bear and relative down to S&P 500 in bull territory.
Utilities (XLU)
SPY/XLU ratio failed to breakdown in March. Then SPY broke above resistance from November 2018 and is moving up relative to XLU. Momentum also went into a bullish zone suggesting further bullishness. We will be looking for a break of momentum above 70 and sustained breakout and some consolidation above resistance from 2018.
Minimum Volatility Index (USMV)
The minimum volatility index(USMV) is underperforming relative to SPX. It has broken the uptrend line and resumed a down move on a relative basis. It is trying to break down from a triangle on an absolute basis. Bullish for stocks.

US Dollar
US Dollar is consolidating around resistance from 2015 and has closed above 61.8% retracement of recent lows. If the US Dollar goes up, bonds fall and yields start moving up.
A strong dollar will have an effect on gold, commodities, Financials and S&P 500.

Gold
Gold is a risk off asset . It broke out from a 3 year base above 2016 high in August 2019 and has been moving up. Currently gold is coiling above Feb 2020 highs above major resistance turned support zone for a possible strong bullish breakout.

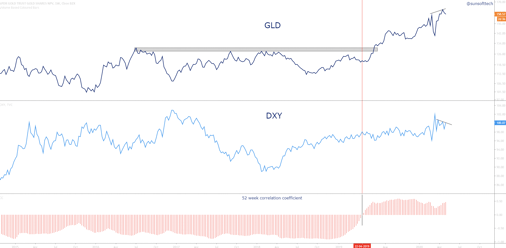
Historically, the US Dollar and yields have been negatively correlated with gold. In January this year, both gold and the US Dollar started moving up and yields continued downwards. In April 2019, the correlation between gold and US Dollar changed from negative to positive.

This leads us to three important pieces in the puzzle – XLF, IWM and Gold
1. XLF
Banks are the largest holding in XLF. If regional banks (KRE) moves up, it will move XLF up along with it. But as JC @allstarcharts points out, KRE is in a bearish momentum regime and its parent sector, XLF, is breaking down to the lowest relative to the S&P 500 since March 2009.
2. IWM
KRE and IYR together form 15% of IWM holding. These will be the two charts to watch for further clues in coming weeks.
3.Gold
Gold is denominated in USD. A strong dollar makes gold expensive in other currencies decreasing the demand.
Gold is a non dividend paying, non yielding asset. Rising yields decrease the demand for gold.
Now, we have two possibilities:
a. Yields break down to the low and continue the down move. In that case bonds will go up. Bearish for stocks.
b. As seen historically, QE will lead to higher yields, taking bonds lower. Bullish for stocks.
These are some of the charts which will provide weight of evidence in either case:
$TLT, $TNX, TYX, $TYSPOT, $FCX, $TIPS, $XLU, $USMV, $XLF, $KRE, $IYR, $IWM
$GLD, $DXY, $UUP
$SPX, $SPY
It will be interesting to watch how gold interacts with the US dollar and yields and its impact stock markets.
